Application Threat Modeling as a Framework for ASPM

Date
Authors
Tony UV
Follow Us


Static and dynamic application security testing (SAST and DAST) remain the default tools most organizations use to find application vulnerabilities, but current benchmark data shows the volume of findings these tools generate has grown far faster than any team’s capacity to triage it. This paper examines what recent large-sample benchmarks actually show about that volume, addresses a genuine problem with how false-positive rates are reported across vendor sources, and argues that application threat modeling functions specifically as the contextualizing layer that Application Security Posture Management (ASPM), as a category, was created to provide.
Introduction
The standard critique of SAST and DAST is familiar: too many false positives, poor integration into fast-moving development pipelines, and findings that describe a code-level flaw without describing whether that flaw is actually reachable by anything a real attacker could touch. What’s less often examined is how large this problem has actually become in measurable terms, and how much of the commonly cited evidence for it can actually be traced to a real, methodologically sound source.
This paper works through that evidence directly. It looks at what a large, named 2026 benchmark shows about enterprise finding volume, addresses the wide and largely unstandardized range of false-positive statistics currently circulating in vendor content, and examines why attack surface is growing faster than most security teams’ triage capacity. It then argues for application threat modeling’s specific role in that environment: not as a replacement for SAST and DAST, but as the layer that supplies the business and architectural context those tools were never designed to produce on their own.
The Volume Problem: What a Named Benchmark Actually Shows
OX Security’s 2026 Application Security Benchmark, drawing on 216 million findings across 250 organizations, found that the average enterprise faces 865,398 security alerts per year. After applying exploitability and reachability analysis, the same dataset narrowed to 795 confirmed critical findings, roughly 0.092 percent of the original volume.
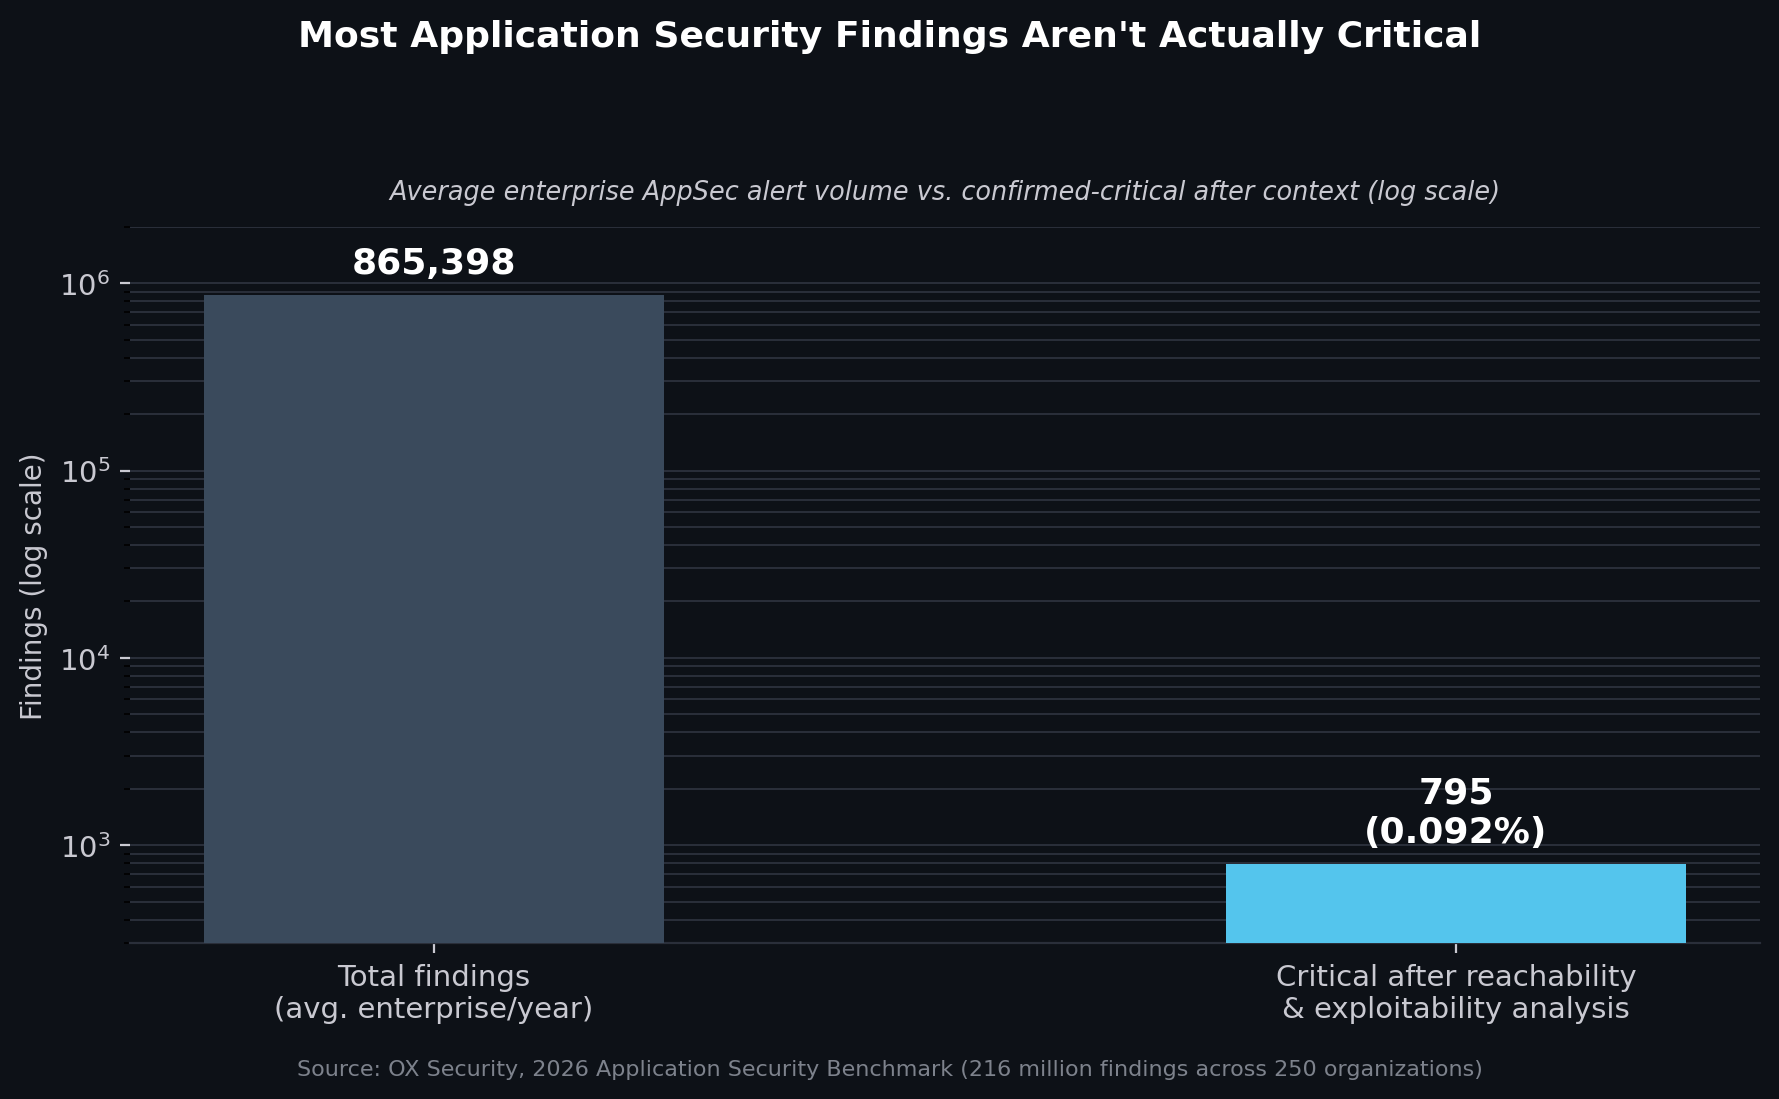
This is a large, specific, named study rather than a generic vendor claim, and the pattern it shows is structurally the same one that shows up in vulnerability management more broadly: the overwhelming majority of what a scanning tool flags is not what an attacker would actually exploit. The gap here isn’t a rounding error. It’s the difference between a finding volume no human team can review manually and one small enough for a team to reasonably act on, and the entire distance between those two numbers is context, exactly the layer that raw scanning output doesn’t supply on its own.
A Note on Inconsistent False-Positive Reporting
It’s worth stating directly: the specific false-positive percentages circulating in current AppSec vendor content are inconsistent to the point of being close to meaningless as precise figures. Depending on which recent source is cited, SAST false-positive rates are reported anywhere from 40 to 91 percent: 40 to 60 percent for SonarQube on default configuration, 71 to 88 percent per one widely cited DevSecOps report, 80 to 90 percent per another vendor’s guide, and 91 percent in a specific 2025 study scanning open-source GitHub repositories. At least one independent 2026 analysis of the SAST, DAST, and SCA tooling landscape states plainly that no major analyst firm has published a standardized, vendor-neutral false-positive benchmark across these tool categories, and that any specific percentage claim in this space should be treated with skepticism unless the source discloses its own methodology.
This matters beyond pedantry. A substantial share of the content making these claims is published by vendors selling an alternative approach, AI-augmented triage, reachability analysis, or a competing scanning product, which gives many of these sources a direct commercial interest in describing traditional SAST and DAST as noisier than a rigorous, independent benchmark might actually find. That doesn’t make the general pattern false; the OX Security benchmark in the previous section, which is specific about its sample size and methodology, points in the same directional conclusion. But it means the exact percentage a reader encounters in most current AppSec content should be read as illustrative of a real problem, not as a precise, comparable statistic.
Attack Surface Is Growing Faster Than Triage Capacity
Independent of how the false-positive question resolves, the raw volume of vulnerabilities being introduced into codebases is increasing sharply. Black Duck’s 2026 Open Source Security and Risk Analysis report, based on more than 950 audited codebases, found that open-source vulnerabilities per codebase have more than doubled year-over-year, reaching an average of 581 per application, and that 87 percent of audited codebases contained at least one known vulnerability.
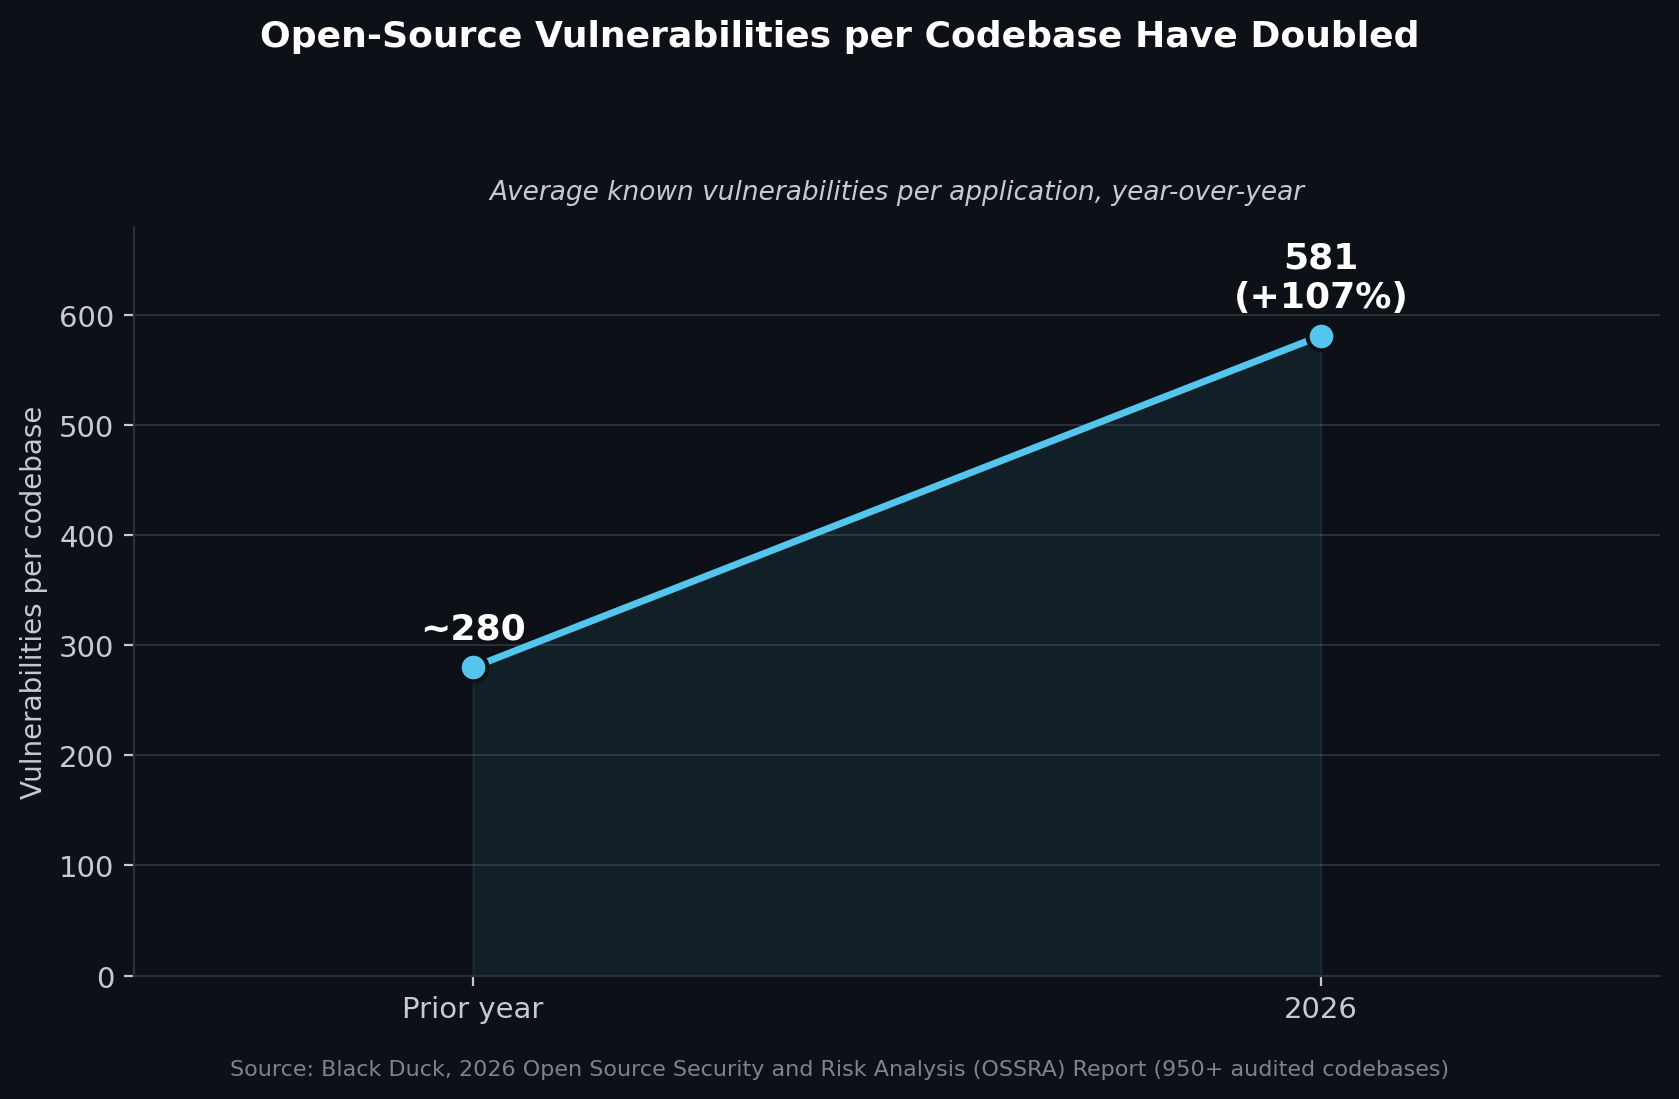
Separately, research on AI-generated code specifically has found it contains substantially more vulnerabilities than human-written code, which suggests this growth curve is unlikely to flatten as AI-assisted development becomes more common, not less. A scanning tool producing a fixed or slowly growing false-positive rate against a codebase whose vulnerability count is doubling year-over-year still produces a rapidly growing absolute number of findings to triage, even if the underlying accuracy of the tool never changes at all.
Why Teams Can’t Simply Work Harder Through the Backlog
The natural response to rising finding volume, adding headcount or working through the backlog faster, runs into a documented capacity constraint. IANS Research’s State of the CISO 2026 survey found that 89 percent of CISOs report their teams are stretched thin or understaffed, and 52 percent say their program’s scope is no longer manageable at current staffing levels.
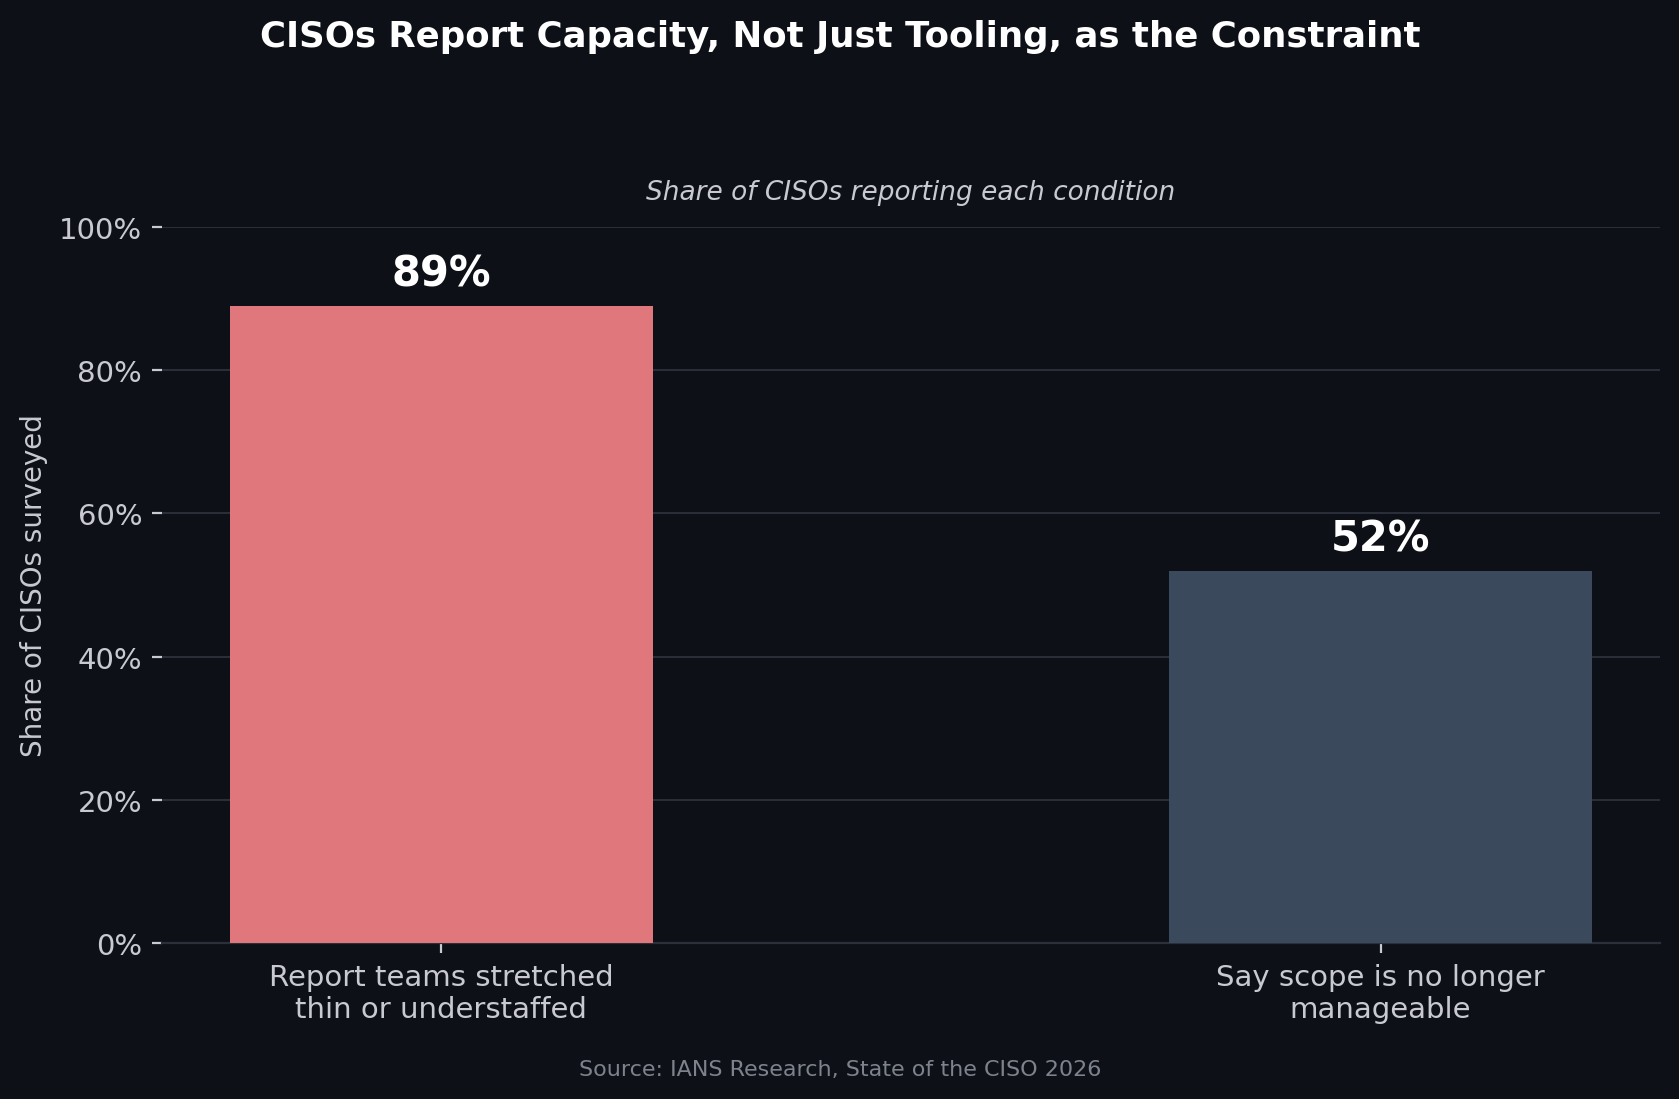
Separately, Veracode’s most recent State of Software Security research found average time to remediate a finding, once triaged, sitting at 252 days industry-wide, and that over 70 percent of organizations carry measurable security debt. Read together with Figures 1 and 2, the shape of the problem is clear: finding volume is growing, the underlying vulnerability count feeding that volume is growing faster, and the teams responsible for triaging all of it report that their capacity was already insufficient before either trend accelerated. Better scanning alone doesn’t resolve a capacity problem; it can, in fact, make it worse by increasing the volume of output competing for the same fixed review capacity.
What Application Threat Modeling Specifically Adds
Application threat modeling addresses this gap by working in the opposite direction from a scanner. Rather than starting from code and asking whether a pattern matches a known vulnerability class, it starts from business function and architecture, what the application does, what would be costly if it failed, where trust boundaries actually sit, and asks which of the technical findings scanners generate actually sit on a path an attacker could use to reach something that matters.
This reframes what SAST and DAST findings are for. A finding that sits on a component with no path to sensitive data or critical business function, verified against the architecture rather than assumed from severity alone, can be deprioritized with actual justification rather than simply ignored due to alert fatigue. A finding that does sit on such a path, even at a moderate severity score, can be elevated ahead of higher-scored but less-reachable findings elsewhere in the same scan output. This is a structurally different filtering mechanism than reachability analysis alone, since it incorporates business impact and architectural context that a purely code-level reachability check doesn’t capture. PASTA (Process for Attack Simulation and Threat Analysis), the risk-centric methodology developed by VerSprite founder Tony UcedaVélez and Marco M. Morana, is one widely used framework built specifically around this sequence: establishing business objectives and technical scope before any scanner output is evaluated, so that the findings which follow inherit a business-relevance filter that raw severity scoring doesn’t provide.
How This Maps to ASPM as a Category
Application Security Posture Management, as a category, exists to solve a closely related problem: correlating findings across disconnected tools, SAST, DAST, SCA, and others, into a single, prioritized view rather than leaving each tool’s output siloed and separately triaged. Application threat modeling supplies a specific input ASPM platforms generally don’t generate on their own: a structured, business-and-architecture-informed view of which systems and data flows actually matter, produced before code-level scanning even runs, rather than inferred after the fact from correlated tool output.
The two are complementary rather than competing. An ASPM platform without threat-modeling-informed context can correlate and deduplicate findings across tools, which addresses part of the volume problem in Figure 1, but still lacks a principled way to weigh a finding’s business consequence beyond what the underlying scanners report. Threat modeling supplies that weighting. An organization using both is applying two distinct filtering mechanisms, tool correlation and business-risk context, to the same underlying flood of findings, rather than relying on either one alone to do the full job.
Limitations and Open Questions
This paper’s argument has real limits worth stating directly. First, the OX Security benchmark in Figure 1 measures aggregate finding-to-critical ratios across a benchmark population; it does not measure how much of that reduction specifically required application-threat-modeling-informed context versus reachability analysis alone, which several ASPM and reachability-focused tools now perform without an explicit threat modeling step. The case for threat modeling’s specific contribution, business and architectural weighting beyond code-level reachability, is a reasoned inference from what the methodology adds structurally, not a measured comparison against reachability-only tooling.
Second, the false-positive inconsistency discussed directly above is a genuine limitation of the evidence base for this entire topic, not just a caveat. Any claim in this space citing a specific false-positive percentage, including figures that might seem to support this paper’s own argument, should be read with the same skepticism applied to the vendor claims criticized here.
Third, the codebase vulnerability growth figure in Figure 2 measures open-source dependencies specifically; it does not directly measure first-party code vulnerability growth, which may follow a different trend.
Conclusion
The case for application threat modeling as a component of ASPM does not rest on a claim that SAST and DAST are unreliable in some precisely quantified way; the exact false-positive rate circulating in current vendor content is not reliably established. It rests on a narrower, better-supported claim: finding volume is large enough, and growing fast enough, that most of it cannot be triaged manually at all, and the tools generating that volume were not designed to weigh a finding’s business consequence in the first place. Threat modeling supplies that weighting by starting from business objectives and architecture rather than code patterns, which is a structurally different, complementary input to what reachability-focused ASPM tooling provides on its own.
References
- OX Security. 2026 Application Security Benchmark.
- Black Duck. 2026 Open Source Security and Risk Analysis (OSSRA) Report.
- IANS Research. State of the CISO 2026.
- Veracode. State of Software Security Report (SoSS) 2025.
- Ghost Security. 2025 study on SAST false positives in open-source GitHub repositories.
- Tech Insider. SAST vs. DAST vs. SCA: AppSec Testing Compared 2026 (on the absence of standardized false-positive benchmarks).
- UcedaVélez, T., and Morana, M.M. Risk Centric Threat Modeling: Process for Attack Simulation and Threat Analysis. Wiley, 2015.