Continuous Threat Modeling in Agile Development
Date
Authors
Tony UV
Follow Us


“Continuous threat modeling” is frequently used as a general descriptor for threat modeling that happens more than once, without much precision about what cadence the word “continuous” is actually supposed to match. This paper argues the relevant benchmark is deployment frequency, and that current DORA benchmark data shows a deployment cadence gap between performance tiers spanning close to two orders of magnitude. For a meaningful share of development teams, that gap makes any threat modeling process anchored to sprint boundaries or scheduled review meetings structurally incapable of matching actual release cadence, regardless of how rigorous any individual review is. The paper also examines a less-discussed finding in current DORA research: delivery performance clusters shifted toward lower tiers between recent reporting years, meaning the underlying cadence problem is not uniformly improving across the industry.
Introduction
Agile development is often treated as a single cadence for the purposes of security process design: sprints happen, threat modeling should happen inside or alongside them, done. This understates how differently agile and DevOps-influenced teams actually operate. DORA’s Accelerate State of DevOps research, based on tens of thousands of respondents across a decade of annual reporting, classifies delivery performance into tiers with deployment cadences that differ by roughly two orders of magnitude between the fastest and slowest teams. A threat modeling process built around a single assumed cadence, typically the sprint, is implicitly built for whichever tier the process designer had in mind, and may be structurally mismatched for teams operating at a meaningfully different pace in either direction.
This paper examines that mismatch directly. It presents current deployment cadence data by performance tier, addresses a recent and somewhat overlooked finding that overall delivery performance has shifted toward lower-performing clusters rather than uniformly improving, and works through what “continuous” has to actually mean, and where the underlying threat modeling methodology, not just its tooling, has to adapt to remain meaningful at each cadence.
The Deployment Cadence Gap
DORA’s tier benchmarks describe elite performers deploying on demand, often multiple times per day, with lead times under a day and in some cases under an hour. High performers typically deploy at least weekly. Medium performers, the classic sprint-cycle pattern, deploy roughly every one to two weeks. Low performers deploy between once a month and once every six months, with lead times for a single change running one to six months.
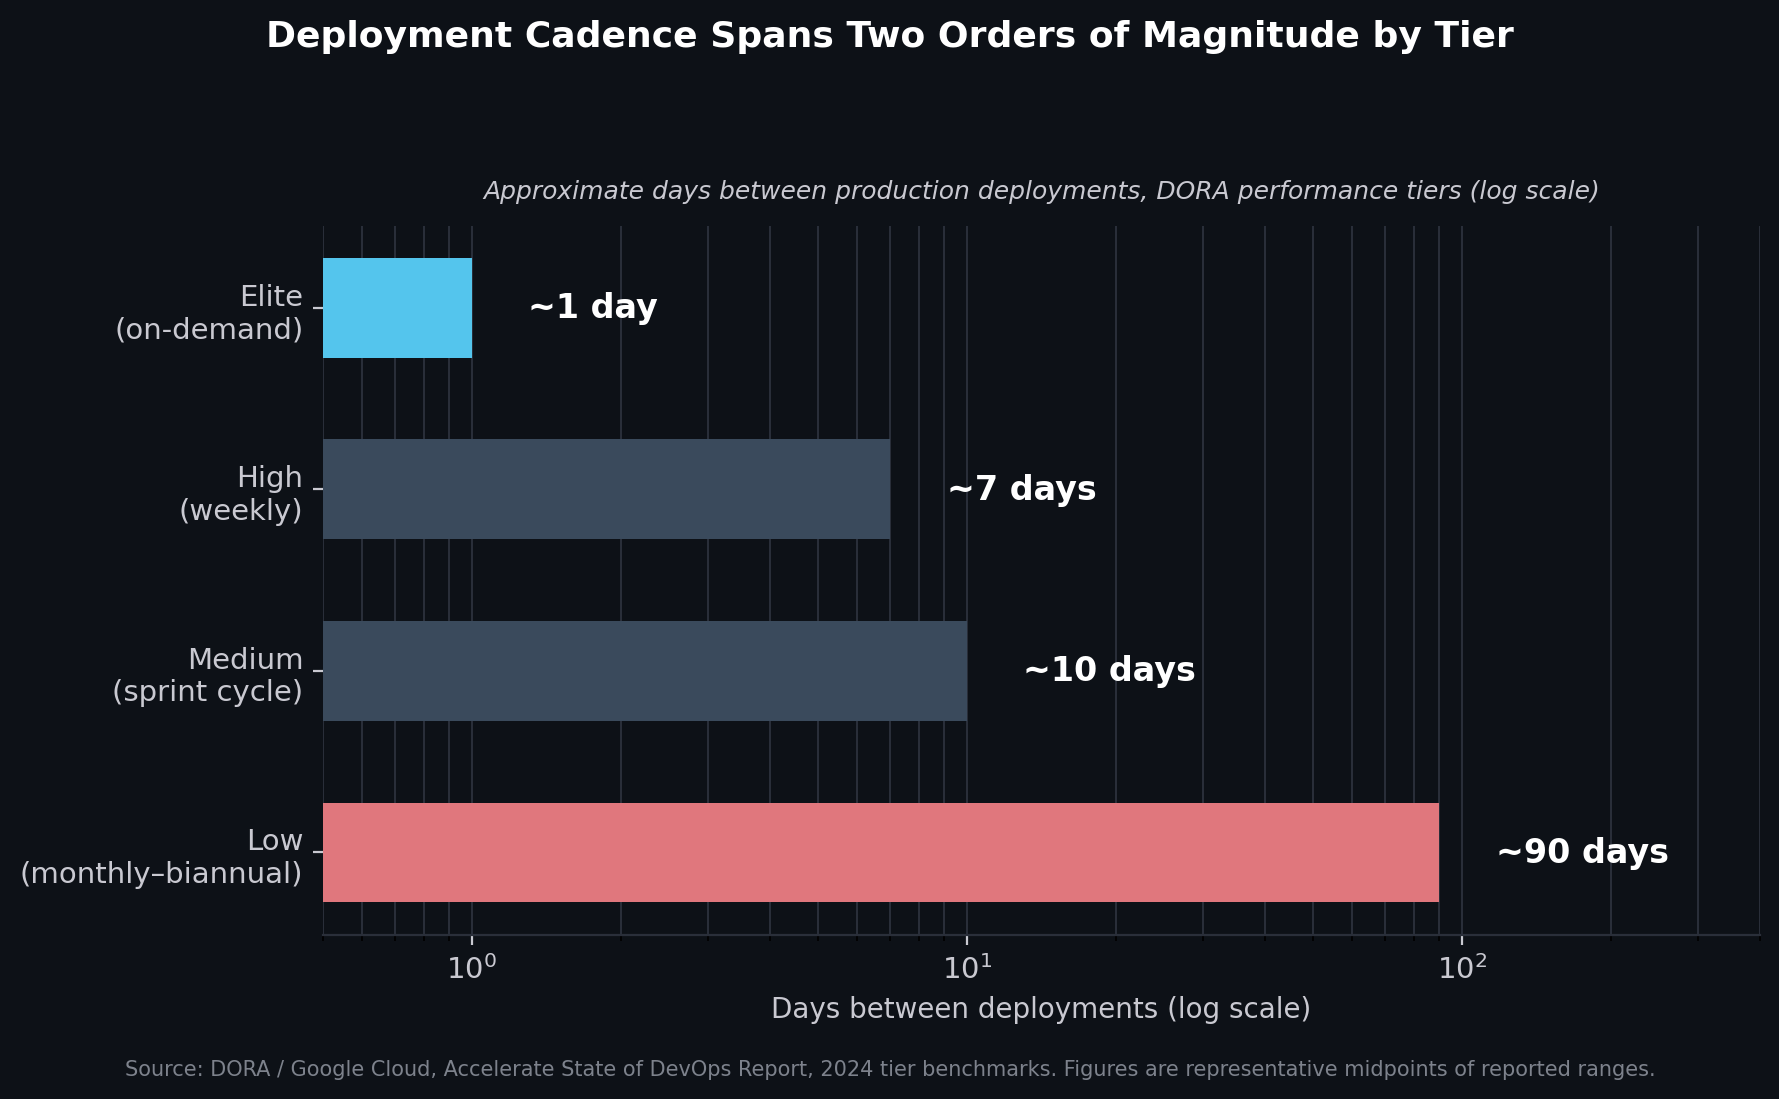
The practical implication for threat modeling cadence is direct. A process anchored to a two-week sprint boundary is a reasonable match for a medium-tier team, roughly matching how often their system actually changes. That same process, applied to an elite-tier team deploying on demand, reviews a system that may have changed dozens of times since the last review, which means most of what shipped between reviews was never modeled against current architecture at all. Applied to a low-tier team, the same sprint-anchored cadence over-reviews relative to actual change frequency, which isn’t harmful, but does mean the review calendar was designed around a delivery rhythm that team doesn’t actually have.
Delivery Performance Is Not Uniformly Improving
A less-discussed finding in recent DORA research complicates any assumption that this problem is simply shrinking over time as more organizations mature toward elite performance. Between the prior reporting year and the 2024 report, the share of teams in the high-performance cluster fell from 31 percent to 22 percent, while the share in the low-performance cluster rose from 17 percent to 25 percent.
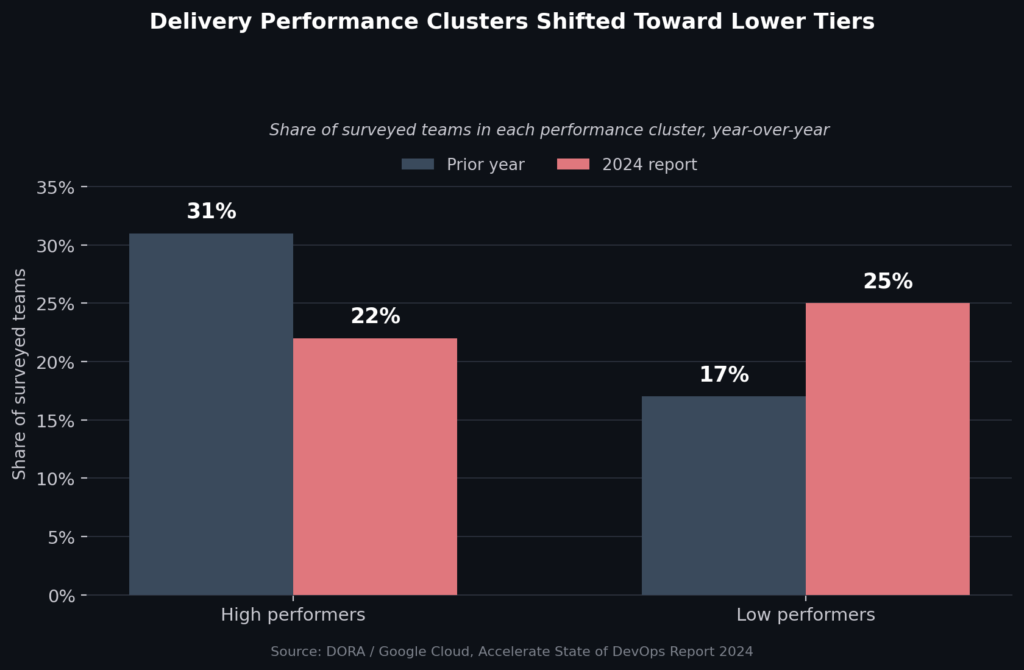
This shift runs against the general narrative that DevOps and agile maturity improve steadily industry-wide. It means a threat modeling program built on the assumption that most teams are converging toward a fast, elite cadence is building against a trend that, in the most recent available data, is moving in the opposite direction for a meaningful share of organizations. A cadence-matching approach to threat modeling needs to account for teams moving toward slower, less stable delivery as much as it accounts for teams moving toward faster delivery, since both directions of movement change what “continuous” needs to mean for that specific team.
What “Continuous” Has to Mean for Threat Modeling Specifically
Given the range in Figure 1, “continuous threat modeling” is only a coherent claim if it’s read as relative to a specific team’s actual deployment cadence, not as a fixed process cadence applied uniformly. For an elite-tier team, continuous plausibly has to mean something closer to real-time or near-real-time model updates tied to code and infrastructure changes directly, since any human-scheduled review cadence, even a fast one, will lag actual change frequency by a meaningful margin. For a medium-tier, sprint-cycle team, a per-sprint review cadence is a much closer match to actual change frequency, and the coordination overhead of a fully automated, change-triggered process may not be justified by the gap it would close. For a low-tier team, the constraint is usually not review cadence at all; it’s the underlying delivery process itself, and threat modeling cadence improvements are unlikely to matter much until the broader delivery pipeline changes.
This means the correct threat modeling cadence is a function of a specific team’s measured deployment frequency, not a general best practice applied the same way regardless of how that team actually ships software.
Where Methodology, Not Just Cadence, Has to Adapt
Matching cadence alone doesn’t resolve the underlying analytical problem. A review that happens more frequently but still evaluates findings against a fixed, generic severity scale doesn’t become more accurate by happening more often; it just produces the same category of inconsistent prioritization faster. PASTA (Process for Attack Simulation and Threat Analysis), the risk-centric methodology developed by VerSprite founder Tony UcedaVélez and Marco M. Morana, addresses this at the level of methodology rather than cadence: its structure ties findings to business objectives and technical scope established up front, which is what allows a faster review cycle to still produce findings ranked by actual consequence rather than only by how recently the review happened. Cadence and methodology are separate variables, and closing the gap in Figure 1 without addressing the underlying prioritization logic risks producing more frequent noise rather than more frequent, credible signal.
The AI-Assisted Development Complication
Current DORA research adds a further complication specific to 2025 and 2026: increased AI-assisted development adoption correlates with increased change failure rate, even as it improves measures of individual developer effectiveness and code quality in isolation. The likely mechanism is straightforward: AI tooling increases the rate of code generation faster than review, testing, and deployment infrastructure can absorb it, which means the deployment cadence figures in Figure 1 may themselves be shifting further, and unevenly, as AI-assisted development spreads. A threat modeling cadence calibrated to 2024 deployment benchmarks may already be lagging actual 2026 change velocity for teams that have adopted AI-assisted development aggressively, independent of which DORA performance tier they were previously classified into.
Limitations and Open Questions
This paper’s argument has specific limits. First, the deployment cadence figures in Figure 1 are representative midpoints of reported ranges rather than precise values; DORA’s own tier bands are ranges, not fixed numbers, and actual team-level cadence varies within each tier. Second, DORA’s own research program replaced its four-tier classification model with a seven-archetype model in 2025, citing the original tiers as masking meaningful nuance in how modern teams actually combine throughput and stability; this paper uses the more familiar four-tier framing from the 2024 report for clarity, but that framing is, by DORA’s own current assessment, an oversimplification of the underlying data. Third, no data cited in this paper directly measures threat modeling cadence itself, only deployment cadence as a proxy for how quickly a system changes; the assumption that threat modeling cadence should track deployment cadence closely is a reasoned inference, not a directly measured finding. Fourth, the AI-assisted development correlation discussed above is early and specific to the 2025 reporting cycle; whether it persists as tooling and review practices mature alongside AI adoption is not yet established.
Conclusion
Deployment cadence varies by close to two orders of magnitude across DORA’s performance tiers, which means a single, fixed threat modeling cadence, most commonly one anchored to the sprint, cannot be uniformly appropriate across teams operating at meaningfully different delivery speeds. Recent DORA data complicates the assumption that this gap is closing on its own, since delivery performance clusters shifted toward lower tiers between the two most recent reporting years rather than converging toward faster, more uniform delivery. Matching threat modeling cadence to actual deployment frequency addresses part of this problem; the other part requires a consistent, risk-based methodology that keeps a faster cadence from simply producing inconsistent prioritization more often, a distinction that cadence improvements alone do not resolve.
References
- DORA (DevOps Research and Assessment) / Google Cloud. Accelerate State of DevOps Report, 2024 edition, tier benchmarks.
- DORA / Google Cloud. State of DevOps Report, 2025 edition (seven-archetype model).
- Forsgren, N., Humble, J., and Kim, G. Accelerate: The Science of Lean Software and DevOps. IT Revolution Press, 2018.
- GetDX. DORA Metrics: The Complete Guide to Measuring DevOps Performance in the AI Era, 2026 (on AI adoption and change failure rate correlation).
- UcedaVélez, T., and Morana, M.M. Risk Centric Threat Modeling: Process for Attack Simulation and Threat Analysis. Wiley, 2015.